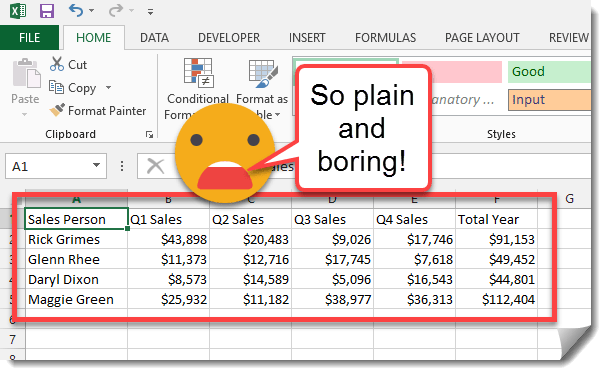
Step 1: Add a table style.
Adding a table style is a quick and easy way to make your data stand out. Like magic, your table is perfectly styled and already much more appealing.
Step 2: Add visualization to your data with in cell data bars.
Now that the table is styled, let’s add some visualization. No one like looking at numbers when can see a picture instead. Repeat the above steps while this time only highlighting the Totals. Select a different Fill Style for the Totals to differentiate. Now you can easily see at a glance who has the most sales and in what quarter.
Step 3: Add spark line graphs.
To add an extra special touch let’s add some spark line graphs.